
4. Future Population and Land Use Forecasts
4.1. Households and Employment
WCOG maintains a four-step, trip-based travel demand model that uses current and forecast population and employment data from the Whatcom region to analyze the impacts that specific projects and programming could have on the efficiency of the region’s road network. Two main components make up the travel demand model:
- a road and transit network comprised of regionally significant roadways (described in the next section)
- a geography of traffic analysis zones (TAZs) that contain population, employment, and school data, also known as the model’s land-use
TAZs are bounded by the regionally significant road system. Their geographies are modeled after census geographies, with each TAZ’s population and employment data being informed by census data. Generally, TAZ boundaries are drawn around areas of relatively homogenous transportation activity. Rural areas with more dispersed households and employment centers have larger TAZs, whereas urban areas with more concentrated land-uses have smaller TAZs. This can be seen in Figures 5 and 6 below.
Households (a function of population) and employment (jobs) are critical land-use inputs in developing an accurate travel demand model. They determine the trip-making characteristics of the TAZs – how much traffic is loaded onto the regional transportation system and where it is going – so that model scenarios can be developed to determine the effect from changes to the road system. Transportation planners use outputs from these scenarios to determine future demand and develop strategies to meet it, as well as to accomplish other regional transportation goals.
More information about WCOG’s travel demand model can be found on our website here: WCOG Regional Travel Demand Model.
4.2. Base Year 2019
The Way to Go, Whatcom regional transportation plan (RTP) uses 2019 as its base year for describing current regional demographic data and transportation conditions. This year is chosen because it contains the most up-to-date aggregation of census data from sources like the U.S. Census Bureau and the Washington State Office of Financial Management (OFM) at the time of the plan update. The most recent major update to WCOG’s travel demand model also occurred the year previous in 2018. The accuracy of the data from 2019 allows WCOG to build a defensible long-range forecast. WCOG’s previous RTP adopted in 2017 had a base year of 2013.
4.3. Forecast Year 2045
By federal regulation, regional transportation plan updates must be adopted a minimum of every five years and address no less than a twenty-year planning horizon as of the effective date of the plan (23 CRF 450.324). WCOG’s 2017 RTP had a forecast year of 2040. Keeping in line with this trend, the year 2022 plan has a forecast year of 2045.
Although regional transportation plans and city/county comprehensive plans follow different update schedules, the two planning cycles will often have closely overlapping update years, allowing MPO planners to leverage the expertise of dedicated long-range planners from local jurisdictions in developing accurate land-use forecasting. The most recent adoption of comprehensive plans occurred in 2016, one year before the previous RTP adoption, and had a base year of 2013 and a forecast year of 2036. With local comprehensive plan adoption not slated again until 2025, 2036 is still the most recent comprehensively developed forecast of demographics in the region, and as such much of Way to Go, Whatcom’s forecasting to 2045 is derived from extrapolating trends from the 2036 forecast.
More information on Whatcom County’s 2036 comprehensive plan can be found on the county’s website here: Whatcom County Comprehensive Plan.
Figure 3: Base Year and Forecasted Households and Employment, 2013-2045
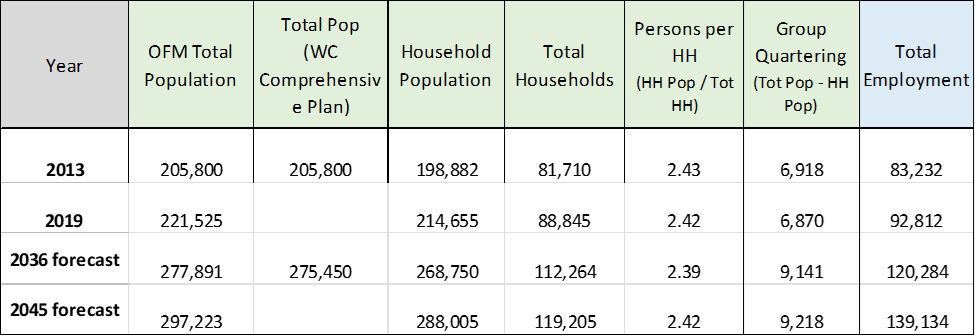
The US Census Bureau defines group quartering as “places where people live or stay in a group living arrangement that is owned or managed by an organization providing housing and/or services for the residents.” These are differentiated from typical housing units such as houses and apartments, and their population make up the gap between Total Population and Household Population.
Forecasting the growth of households in the region starts with population projections. Way to Go Whatcom uses the medium series from OFM’s most recent Growth Management Act county population projections from 2017 to determine the projected total population of Whatcom County in 2045, as shown in Figure 3. The number of persons per household are derived from census block data from 2019 OFM datasets, annual city statistics computed by OFM, and input from City of Bellingham planners. Using base year household occupancy rates and persons per households in conjunction with population projections, a forecast of household population and total households is estimated.
Figure 4: Employment Growth, Base Years to Forecast Years
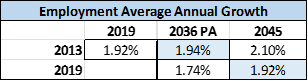
Base year employment figures are derived from the U.S. Bureau of Labor Statistics with the help of the City of Bellingham. Because of the volatility of forecasting employment, the 2045 forecast is based on an extrapolation of the employment growth estimate between the new 2019 base year and the most recent 2036 Whatcom County comprehensive plan forecast. As highlighted in Figure 4, this extrapolation produces comparable annual growth rates for the Whatcom region between the 2013-2036 and 2019-2045 forecast periods.
Figure 5: Projected Whatcom Region Household Growth by TAZ, 2019-2045
Figure 5 displays household growth density in the Whatcom region – the number of new households forecasted between 2019 and 2045 divided by the area of the TAZ encompassing the growth. Select individual TAZs in the map to view TAZ-specific household data.
Figure 6: Projected Whatcom Region Employment Growth by TAZ, 2019-2045
Figure 6 displays employment growth density in the Whatcom region – the number of new jobs forecasted between 2019 and 2045 divided by the area of the TAZ encompassing the growth. Select individual TAZs in the map to view TAZ-specific employment data.