
8. Financing the Regional Transportation System
Operation and preservation of our transportation system, as well as completion of the 20-year project list contained in the previous section, requires funding. This section of Way to Go, Whatcom discusses the funding sources that are anticipated to be available to implement the strategies and projects in this plan along with recommendations for additional financing strategies. In accordance with federal regulations, the regional transportation plan is fiscally constrained, i.e., its projections of future funding are conservative to increase the likelihood that the cost of planned projects will not exceed available funding. WCOG’s analysis of regional transportation costs and revenues is based on historical revenue and cost data, current state and federal funding authorizations, and conservative projections of recent revenue and spending trends. This analysis considers the characteristics of each program area, such as local roads, state highways, bicycle and pedestrian facilities, and transit.
Obviously, shorter-range financial forecasting tends to yield more accurate results than that performed for time periods further in the future. Factors that may influence longer term transportation financing include rapid advancements in technology (e.g. connected infrastructure), increasing private-sector options from transportation network companies (e.g. Uber and Lyft), improvements and changes in vehicular fuel sources towards cleaner energy, and evolving travel behavior and generational preferences such as the trend among younger adults to live in urbanized areas without owning a car. For these reasons, Way to Go, Whatcom’s financial forecast is broken into two time periods:
- 2022-2032: This forecast period is fiscally constrained and based on a list of programmed and planned projects that will or are highly likely to be advanced by the region’s jurisdictions.
- 2033-2045: Outer-year revenues and planned expenditures are aggregated in recognition of the increased chance of changes in project costs, economic conditions, regulations, and local priorities.
8.1 Financial Assumptions
Federal, state, and local revenue estimates change over time and are revised regularly due to a variety of factors, including adjustments for actual uses, changes in funding estimates, and other economic conditions. Despite fluctuations, the estimates in this plan depend on some reasonable assumptions to set a baseline and estimate future conditions in transportation funding for the region. Assumptions include the following:
- Federal funding will continue to be available in similar amounts for regional roadway and transit infrastructure. The adoption by Congress of federal transportation authorizations that are historically created and enacted every few years, currently the Infrastructure Investment and Jobs Act also referred as “Bipartisan Infrastructure Law” that was signed into law on November 15, 2021, will continue through the year 2045.
- Because the Whatcom region’s economic vitality and quality of life depend on a functioning transportation network, state agencies and local jurisdictions will continue to invest to maintain and preserve the transportation network. Therefore, it is assumed that state and local financial resources will continue to be available through the year 2045 with levels comparable to recent years.
- Funding will support the transit system through the year 2045. Transit funds in the region are administered through the Whatcom Transportation Authority (WTA) in the form of federal grants, sales tax revenue, fare revenue, and interest earnings. WTA will likely continue to use federal relief funds to replace lost revenue, manage expenses and maintain reserve levels. The agency continues to pursue innovative financing strategies to maintain its level of service.
- Bond proceeds and debt payments have a minimal influence on transportation investments in the region, and that will continue to be the case. Since bond revenues are generated by individual initiatives rather than part of ongoing, legislated authorizations, they are difficult to forecast and have been excluded from Way to Go, Whatcom’s financial forecast.
- The Port of Bellingham manages Bellingham International Airport as well as maritime freight activities in the region. However, costs and revenues associated with aviation and marine freight are not directly covered in this plan and therefore funding for those activities is not included in Way to Go, Whatcom’s financial forecast. (Information on the Port of Bellingham’s planning activities can be found by clicking on this link.)
8.2 Historical and Current Funding
As mentioned previously, the Whatcom region uses several funding sources from various levels of government to pay for regional transportation. Historical revenues and expenditures inform the regional transportation plan’s financial forecast.
8.2.1 Federal Funding
The Whatcom region receives federal support through two primary sources:
- U.S. Federal Highway Administration: FHWA provides funding for a number of regional projects through several programs, including the National Highway System, Interstate Maintenance, the Surface Transportation Block Grant program, and Coordinated Border Infrastructure program.
- U.S. Federal Transit Administration: FTA administers programs to fund regional transportation agencies through its Rural Transit Assistance Program, Metropolitan and Statewide Planning program, and the Transit Cooperative Research program.
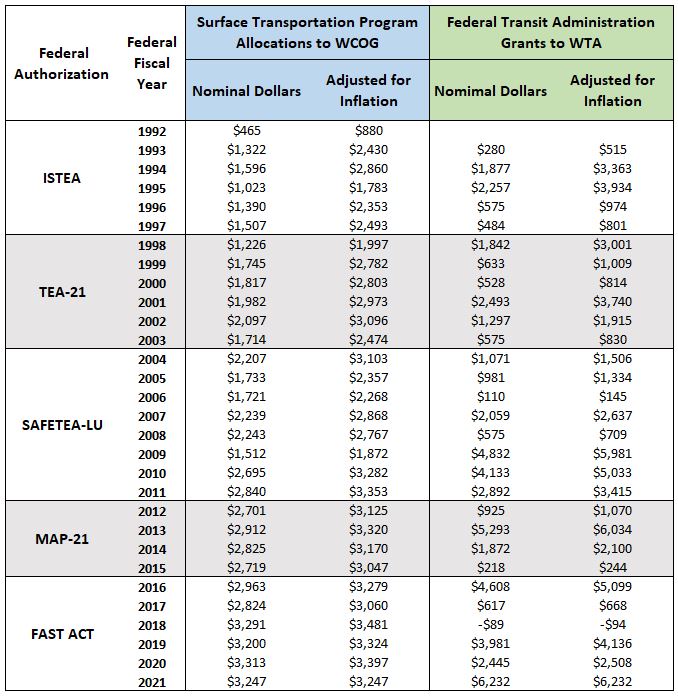
Federal Highway Administration STBG program funds are allocated to WCOG, while FTA Section 5307 grant funds are managed by WTA. Both funding programs receive apportionments based on the federal authorization at the time. Figure 19 illustrates the federal transportation funding in the region since 1992.
Figure 19: Federal Highway and Transit Allocations to the Whatcom Region (in 000s)
8.2.2 State Highway Funding
WSDOT manages the state highway system. In the Whatcom region, state highways make up 11 percent of all roadway miles and 45 percent of regionally significant roadway miles.
The majority of the region’s vehicle-miles-traveled (VMT) also occurs on the state highways. WSDOT funds state highways from its apportionment of federal highway aid and with state revenues primarily generated from fuel tax. Figure 20 illustrates historic and anticipated WSDOT expenditures by funding category, including preservation, safety, mobility improvements, environmental, and other projects. Note that WSDOT currently has investments identified in the regional and state capital improvement program for years 2022-2026.
Figure 20: WSDOT Past and Near Future Program Expenditures
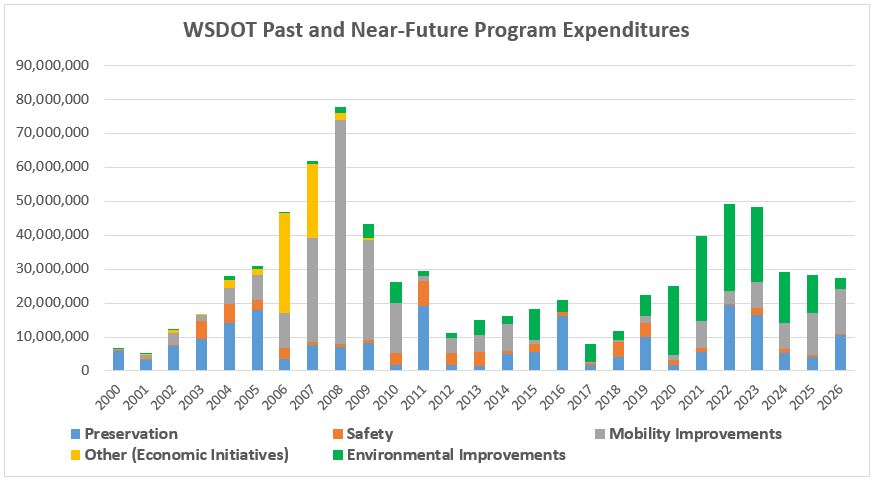
A peak in state program funding occurred from 2006 to 2009 under the federal transportation authorization Safe, Accountable, Flexible, Efficient Transportation Equity Act: A Legacy for Users (SAFETEA-LU) as well as via annual legislative appropriations that benefited the Whatcom region. The near-future program has prioritized investments into improving fish passage barriers for salmon migration.
8.2.3 Local Funding
Whatcom County’s seven incorporated cities maintain local roads within their respective jurisdictions, while the county maintains roads in the unincorporated areas. As indicated in Figure 21, the region’s local governments have seen their expenditures increasing at a faster rate than revenue (local tax collection and state and federal grant funds). Expenditures have outpaced revenues an average of 4.6% over the last four years from 2015 through 2018.
Figure 21: County and Cities’ Historical Revenues and Expenditures
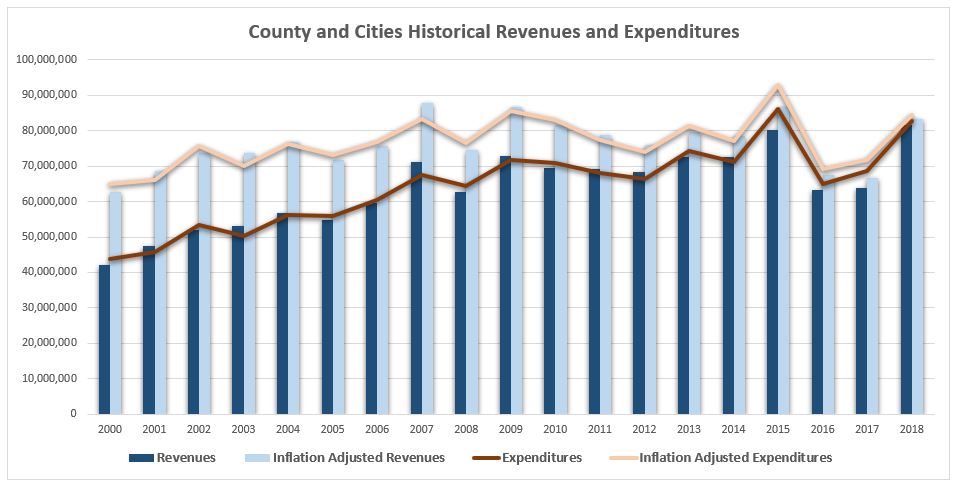
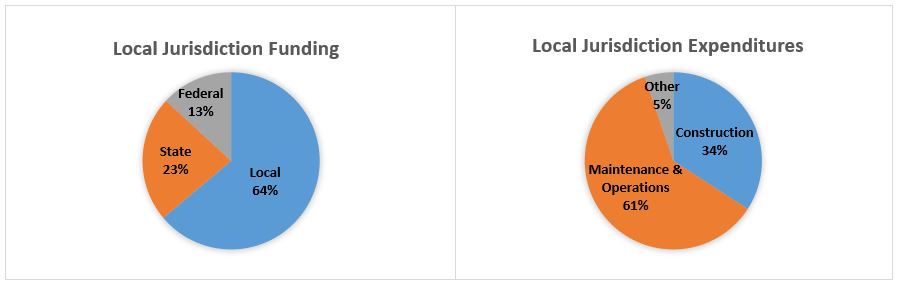
Figure 22 depicts the five-year average from 2014 through 2018 of local jurisdiction funding by level of government as well as the expenditures of those funds towards transportation related investments. The local level generates the greatest source of revenues while investments in system preservation and improvements (also referred as construction) account for over a third of expenditures.
Figure 22: Local Funding and Expenditures
8.3 Revenues and Expenditures Forecast
In general, transportation funding sources are in decline. It is therefore important to consider how funding is designated for specified project categories. For the purposes of this plan, four project types are identified: operations, maintenance, preservation, and improvements.
8.3.1 Operations
Operations involves the personnel, facilities and capital required to administer, plan, run, engineer and police the transportation system.
8.3.2 Maintenance
Maintenance describes work that is performed to maintain the condition of the transportation system or to respond to specific conditions or events that restore the highway system to a functional state of operation. Maintenance is a critical component of an agency’s asset management plan that is comprised of both routine and preventative maintenance.
8.3.3 Preservation
Preservation consists of work that is planned and performed to improve or sustain the condition of the transportation facility in a state of good repair. Preservation activities generally do not add capacity or structural value but do restore the overall condition of the transportation facility.
Preservation activities such as repaving roads, protecting against rock falls, and rehabilitating bridges are identified through a local needs analysis and the Pavement Management and Bridge Management systems. These types of projects tend to result in longer-term benefits and are typically more expensive than maintenance projects. Delayed infrastructure preservation often leads to steep increases in future reconstruction costs.
8.3.4 Improvements
In addition to maintaining and preserving existing system components, this plan includes a recommended set of capital and other improvement projects that improve safety; increase access, connectivity and mobility; support transportation demand management activities, and; promote healthy communities. Improvement projects that add vehicle capacity are typically very expensive, and thus, completing even a small number of these projects reduces a region’s ability to pay for standard preservation and maintenance of existing facilities. Conversely, improvement projects that expand mode sharing, e.g., adding bicycle lanes, tend to be less expensive.
8.4 WCOG Transportation Improvement Program
Anticipated resources for transportation projects listed in the regional Transportation Improvement Program (TIP) have been considered in the financial forecast. The TIP provides a six-year comprehensive list of transportation projects that utilize federal funds, or which are considered a regional project. The total cost of projects programmed, funded, and scheduled to begin in the first four years of the 2022-2027 TIP does not exceed anticipated resources, meaning the program is fiscally constrained.
8.5 Balance Sheet
The assumptions applied to the Whatcom region’s long-term financial forecast include growth estimates based on local, state, and federal sources. There are a host of known and unknown variables that can affect the revenues and expenditures necessary to sustain the regional transportation system.
Figure 23: Estimated Revenues and Expenditures
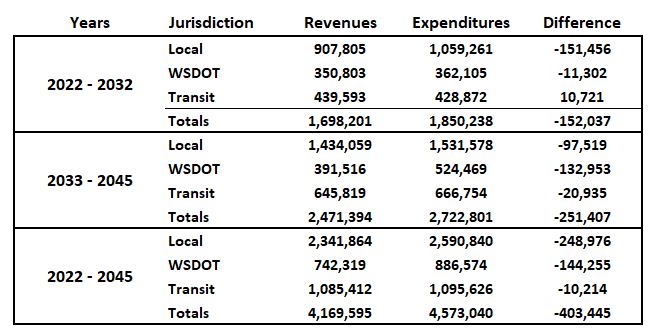
Figure 23 indicates that future revenue will be insufficient to accommodate the rising costs of maintenance, operations, preservation, and improvements for the local and state systems.
8.6 Fiscal Constraint
For a fiscally constrained plan, the +20-year cost of planned investments in the regional transportation system are compared with the available revenues forecasted. Projects are individually prioritized within the first 10-year period (2022-2032) and batched as an aggregate estimated cost for the outer years (2033–2045). Projects fall into three funding-status categories in the regional plan:
- Currently funded projects are those programmed in the TIP and for which construction will commence during the period of 2022-2027. These projects are fiscally constrained.
- Planned projects are expected to secure funding and start construction during the plan’s timeframe within the first 10-year period out to 2032. Some of these projects may also exist in the outer years. These projects are also fiscally constrained.
- Illustrative projects support regional goals, but funding for them has not yet been identified and therefore they cannot be classified as fiscally constrained. However, their inclusion in this plan acknowledges their potential value to the region and constitutes a commitment to seek funding for them.
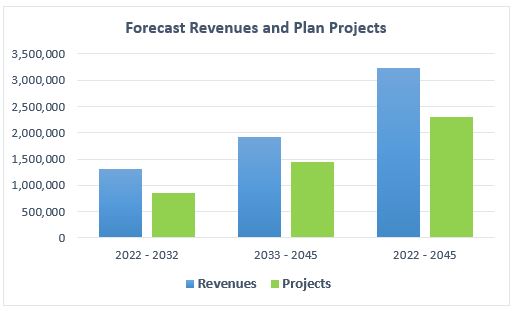
When looking specifically at the total costs of regionally-significant projects listed in the previous section, adequate revenues to pay for those projects are expected to be available for all plan time-periods (Figure 24).
Figure 24: Forecasted Revenues and Plan Projects
8.7 The Financial Gap
When looking at full set of transportation system costs — operations, maintenance, projects, etc. — Available revenues are not estimated to cover anticipated expenditures, especially in the outer years from 2033 – 2045. Over this timeframe, it is difficult to anticipate, or plan, for how travel behavior will impact the growth of vehicle miles traveled (VMT). For this plan, the use of the regional travel demand model estimates that VMT will continue to increase as the population continues to grow throughout the region. Improvements in vehicle fuel efficiency and electrification will continue to reduce fuel tax revenues (assuming the fuel tax will remain as a source of transportation funding). This stresses the importance of prioritizing transportation investments to better maintain a functional regional transportation system. There is no single funding source that will make-up the anticipated revenue shortfall. Rather, employing a combination of transportation strategies and program adjustments will serve to shrink, if not completely bridge, the financial gap.
8.7.1 Local Jurisdictions
Looking ahead to the 2045 planning horizon, Whatcom County and incorporated cities estimate a revenue shortfall of $249 million. The primary revenue sources for the locally-managed transportation system in the Whatcom region include:
- Property taxes collected by Whatcom County provide nearly 50 percent of the revenue generated for transportation spending in unincorporated areas. To a lesser extent, cities also use property taxes to fund transportation.
- City sales taxes and other local receipts contribute over 50 percent of funding used for transportation spending in incorporated areas.
- Federal funds provide about 16 percent of annual regional revenues.
- State funds through General Fund appropriations, state fuel tax distribution, and other state-generated funds such as the County Road Administration Board and the Transportation Improvement Board contribute nearly 25 percent of revenues.
8.7.2 State System
The WSDOT-maintained state highway system will have an estimated shortfall of approximately $144 million through the year 2045. Funding for the agency is primarily generated through the motor vehicle fuel tax. WSDOT also uses other revenue sources such as bond sales, federal funds, road and bridge tolls, and ferry fares.
8.7.3 Transit
The Whatcom Transportation Authority (WTA) capital and operations revenues closely align with expenditures through the plan’s outer years, falling short by less than one percent. Funding availability for transit recently increased over the next few years with the approval of Move Ahead Washington legislation. The WTA 2040 plan describes implementation funding for the longer-term objectives to come from a variety of sources with “a greater portion of resources be directed to capital investments” to accommodate improvements and expansion to the WTA service network. (WTA 2040 E.S.)
8.8 Future Regional Funding Strategies
This section discusses options for generating additional revenue – either for closing the funding gap estimated for years 2034-2045 or for funding additional investments or new strategies identified during the next several years.
8.8.1 Reasons to Consider New Revenue Sources
Forecasted Shortfall in Regional Revenue
As indicated in the first part of this chapter, it is hard to ensure that WCOG’s 20-year project list will have sufficient funding to be fully implemented. (More detailed citation of estimated shortfall or better definition of risk). Strategies explored below could help generate revenue to advance regional goals.
Forecasted Decline of Current Revenue Sources
It is well understood that fuel tax revenues, the primary source of transportation funding (at the national level and for Washington State), is declining and not sustainable. As vehicles have become more fuel-efficient, and the vehicle fleet continues to shift to an increasing share of electric vehicles that don’t use taxed fuels, fuel tax revenues are declining as vehicle miles traveled (VMT) on our roads continues to increase. While this trend affects funding that comes to the region via federal and state programs, several Whatcom region jurisdictions collect local-option fuel taxes authorized for cities or transportation benefit districts (TBDs) within ten miles of the Canadian border.
At the state level, the Washington State Transportation Commission has completed a study and pilot project to develop proposals for transitioning the state’s fuel tax to a per-mile road usage charge (RUC). While the proposal is for a transition over many years, the work has identified various technologies (In-vehicle devices with or without GPS, smart phone apps, odometer upload options) and policy considerations (fee adjustments related to vehicle weight and/or emissions; income) that would be useful to consider as part of many possible future transportation financing strategies.
8.8.2 WCOG’s Financial Working Group
To inform this discussion, WCOG convened a financial working group composed of staff from member jurisdictions.
The objectives of the Financial Working Group were as follows:
- Assess revenue strategies that are available to Whatcom jurisdictions under state law.
- Improve collective understanding of “local-option” revenue strategies already being used by the region’s jurisdictions.
- Identify those strategies that seem to be the most feasible and effective so that they may be more readily considered by decision makers for possible expansion or adoption.
- Consider if any revenue strategies would work as a regionally coordinated strategy or (at least among two or more jurisdictions).
- Evaluate the near-term likelihood of increased federal funding and/or new state transportation revenue and the probability either or both of those will change the fiscal forecast for Whatcom Mobility 2045.
Participants in the Financial Working Group included: WCOG, WSDOT, City of Bellingham, Whatcom County, and the Whatcom Transportation Authority.
8.8.3 Authorized Regional Transportation Revenue Options an Which Whatcom Jurisdictions are Using Them
As part of the discussion with its Financial Working Group, WCOG used resources available from the Municipal Research and Service Center of Washington (MSRC) to research and document an inventory of which public financing options for transportation investments were currently available to Whatcom County jurisdictions and whether or not those options were currently being used.
Spread sheets detailing this assessment are available here but a summary of findings is as follows.
Property Taxes
Options used in Whatcom County:
- County Road Levy used by Whatcom County
- Revenue Development Areas (RDAs) have been used by Bellingham and the Port of Bellingham.
Options not used in Whatcom County:
- Excess Property Taxes
- Tax Increment Financing
- Real Estate Excise Taxes (REET)
- Passenger-only Ferry District (County would be allowed to establish)
Fares/Service Fees
Examples of these include:
- Parking garages/lots such as operated by the City of Bellingham and the Port of Bellingham
- Parking meters
- WTA Bus and Whatcom Chief ferry fares
Transportation Benefit District (TBD)
Bellingham, Blaine, Ferndale, Lynden, and Whatcom County have formed and use a transportation benefit district. All except Whatcom County fund the TBD with an addition to sales tax. Whatcom County’s TBD is set up to enable collection of the Border Area Fuel Tax in Point Roberts. TBDs can also be funded by locally imposed vehicle license fees.
Non-TBD Local Option Sales Taxes
- All eligible Whatcom County jurisdictions have applied the unrestricted local-options sales tax for transportation and for public safety.
- WTA is using the Transit Sales Tax option.
Sales Tax Credits
None of the cities or the county is using the Local Infrastructure Financing Tool (LIFT) which would be funded using sales tax credits.
Local Option Fuel Taxes
Options used in Whatcom County:
- Blaine, City of Nooksack, Sumas, and Whatcom County (in Point Roberts) use the optional Border Area Fuel Tax.
Options not used in Whatcom County:
- A Local Option Fuel Tax can be applied by counties. Whatcom County, nor any other county in the state has implemented this option.
Commercial Vehicle Parking Tax
State law allows cities, counties, or districts to tax operators of parking facilities. No jurisdictions in the Whatcom region currently do this.
Municipal Debt
No Whatcom jurisdictions currently use Municipal Debt – e.g. bonds, local improvement districts (LIDS), or loans.
Impact Fees
Bellingham, Blaine, Ferndale, and Lynden all assess impact fees on developers to help fund mitigations to development related increases in travel demand.
Federal Timber Sales Revenue Sharing
This is used by Whatcom County.
Federal and State Formula and Discretionary Funding Programs
As largely accounted for in the first section of this Finance chapter, local jurisdictions, primarily by way of the Washington Department of Transportation (WSDOT), receive federal gas-tax revenues via various formula programs, additionally through federal discretionary programs, and state discretionary programs.
8.8.4 Most Feasible Options for Regionally Generated New Revenue
Based on review of the above as well as discussions among the Financial Working Group, a few options appear to have more potential fit with possible needs for more revenue. Given the Whatcom region’s transportation system goals and existing project list, out-year projects and project types with uncertain funding include:
- Expanded transit services and infrastructure (e.g. bus rapid transit, on demand services, transit street design improvements),
- Non-infrastructure strategies to reduce fatal and serious injury crashes (e.g. education, enforcement, communications, new and modified laws).
Transportation Benefit Districts (TBDs)
Jurisdictions that haven’t yet set up a TBD could consider doing so. Jurisdictions could also consider a regional TBD for investments of shared interest over larger geographies.
2022 state transportation legislation increases amount of additional sales tax that voters may approve for TBDs)
Border Area Fuel Tax Options
As mentioned above, most eligible Whatcom jurisdictions have elected to collect a border-area fuel tax (currently 1 cent per gallon). While within the 10-mile distance from the U.S.-Canada border, Lynden and Ferndale have not added a border-area fuel tax.
Additionally, if a TBD was formed that included at least one international border crossing in its boundaries, the border-area fuel tax could be collected within that TBD.
2022 state transportation legislation increases optional border fuel tax from 1 cent/gallon to 2 cents/gallon.
Tax Increment Financing (TIF)
In 2021, the Washington State legislature passed HB 1189 authorizing the use of tax increment financing by counties, cities, and port districts.
8.8.5 Possible Future Strategies
In addition to possible future needs for additional revenue, other possible motivations for adding or switching to different revenue types include:
- Declining returns from fuel taxes related to vehicle electrification and inflation,
- Possible future decisions to improve system performance with pricing (e.g., fare-free transit, tolling, congestion pricing, HOT lanes).
8.8.6 Road Usage Charge (RUC)
In the most basic terms, a road usage charge would be based on the distance vehicles travel on public roads.
In 2020, Washington completed a Road Usage Charge Study which includes recommendations for transitioning the state from the current fuel-tax system to a RUC system. Transitioning to a RUC will require decisions about reporting methods and technologies, rates, phasing, etc.
It is unclear if the emergence of a RUC system would create opportunities for integration with regional revenue and/or operations strategies. Would there be local-option RUC rates? If conversion to a RUC system required vehicles to be equipped with readable technology (E.g., radio frequency tag, transponder, etc.), such systems could possibly support use of other revenue and/or systems operations strategies like congestion pricing, HOT lanes, etc.)